GHG Management
GHG Inventory
From Nearly Zero to Net Zero
"Net-zero emissions" is the top priority of climate action. Not only have governments around the world announced net-zero emissions targets, companies also actively planned the net-zero pathway. As a leader in the real estate service in Taiwan, Sinyi Realty takes the lead in setting "Get to Net Zero" as one of the Sinyi Sustainable Principles, aiming that Sinyi Realty and Sinyi Group achieve net zero in 2030 and 2050 respectively. We have taken part in international and domestic climate initiatives; proactively taken GHG inventory; promoted carbon-neutral and sustainable branches; supported renewable energy, etc. We have been reducing carbon emissions with the hope to become a model for green real estate service.
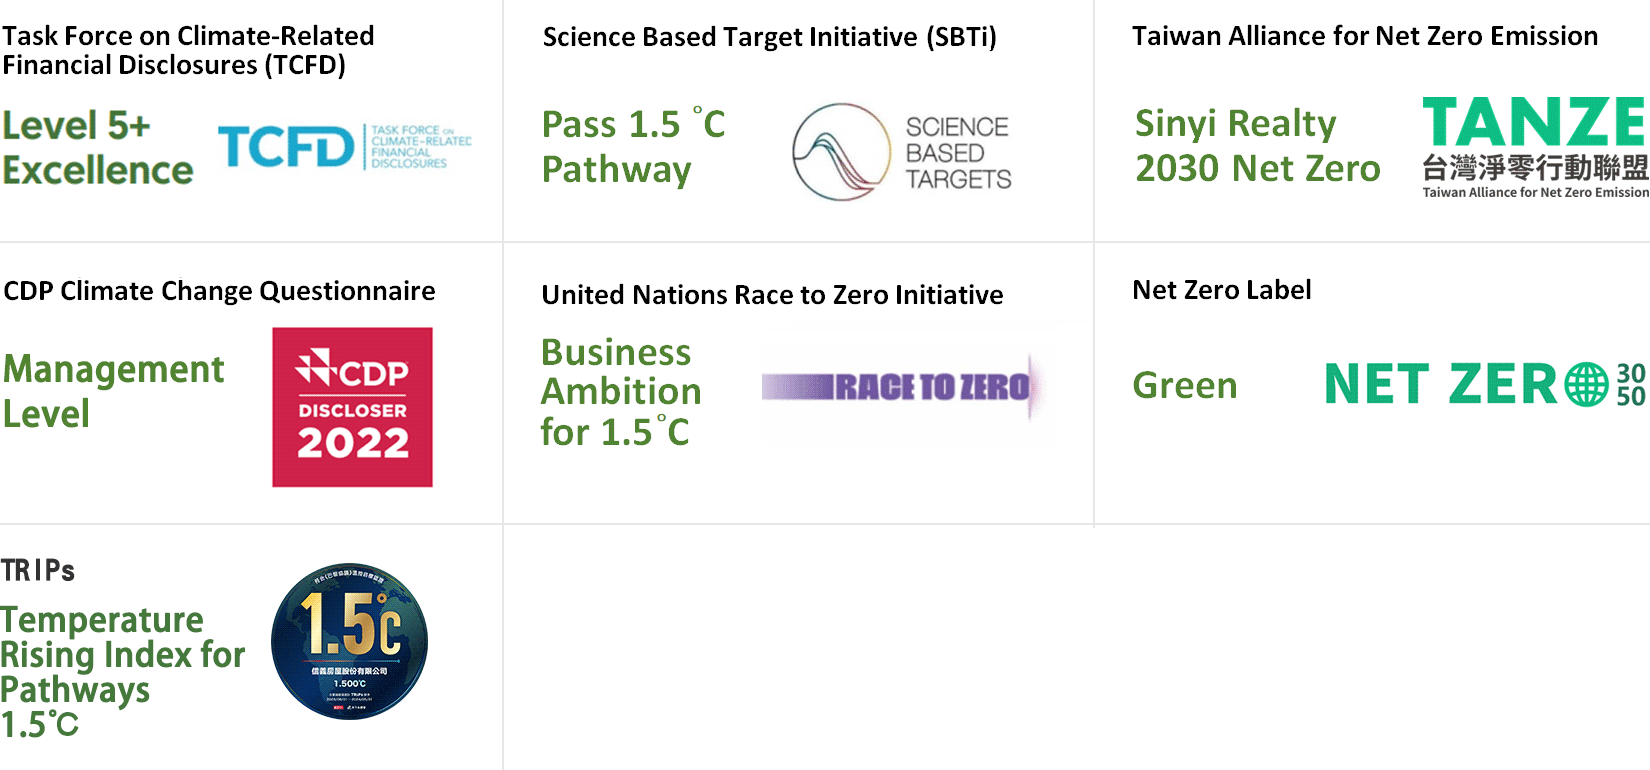
Sinyi Realty’s emission reduction target is in line with the Paris Agreement 1.5°C goal and approved by SBTi.
Sinyi Realty has joined the Net Zero X 2030/2050 Initiative, and committed to achieve the goal of Net Zero by 2030.
Sinyi Realty obtained Net Zero Label, graded “Green”.
In 2022, Sinyi Realty obtained “Temperature Rising Index for Pathways Label(TRIPs)”, in line with the Paris Agreement 1.5°C goal.
Net Zero Pathway
GHG Inventory and Carbon Reduction Management
Sinyi Realty has proactively taken Green House Gas (GHG) inventory and carbon management. We have not only been conducting GHG inventory for headquarters building since 2014 but also expanded to all branches since 2017, in response to stakeholders' concerns. We periodically disclose the environmental performance on different platforms such as Sinyi Realty Sustainability Report, our webtsite, and CDP, so the stakeholders can access our reduction targets and progress.
Sinyi Realty has joined CDP Climate Change 3 years in a row since 2020.
GHG emissions (category 1+2) in 2022 was reduced by 5.9% compated to 2021.
The headquarters building and some branches have been supplied by renewable energy since 2022.
355 MWh renewable energy was used, accounted for 3.1% of total electricity consumed in 2022.
GHG Inventory of 100% Operations Sinyi Realty’s Operating Boundary
Inventory scope: Headquarters Building, Operating Branches, Local Administrative Centers,
First hand New House Selling Department
Period: 2022/01/01~2022/12/31
In accordance with ISO 14064-1:2018 requirements, we adopted the operational control method to take GHG inventory included direct GHG emissions (category 1), indirect GHG emissions from imported energy (category 2), and other indirect GHG emissions (category 3-6), covering 100% of operating acitvities in Sinyi Realty’s operating boundary. The GHG calculated included CO₂, CH₄, N₂O, HFCs, PFCs, SF₆, and NF₃.
Sinyi Realty’s GHG inventory in 2022:
- The direct GHG emissions (category 1) were 454.706 tonCO₂e.
- The indirect GHG emissions from purchased electricity (category 2) by market-based approach were 5,519.499 tonCO₂e.
- The indirect GHG emissions from all other sources (category 3-6) were 3,510.970 tonCO₂e.
The GHG Emissions and Removals Information for All Categories
| Emissions | tonCO₂e |
|---|---|
| Category 1: Direct GHG emissions | 454.706 |
| Category 2: Indirect GHG emissions from imported energy (market-based) | 5,519.499 |
| Category 3: Indirect GHG emissions from transportation | 1,148.674 |
| Category 4: Indirect GHG emissions from products used by organization | 2,133.941 |
| Category 5: Indirect GHG emissions associated with the use of products from the organization | 228.355 |
| Category 6: Indirect GHG emissions from other sources | 0 |
| Direct emissions from biomass | 0 |
| Removals | tonCO₂e |
| Direct removals | 0 |
| Removals from biomass | 0 |
The GHG Emissions information for category 1
| Category | CO₂ | CH₄ | N₂O | HFCs | PFCs | SF₆ | NF₃ | Emissions Equivalent | |
|---|---|---|---|---|---|---|---|---|---|
| 1.1 | Stationary combustion | 0.4908 | 0.0006 | 0.0011 | 0 | 0 | 0 | 0 | 0.4925 |
| 1.2 | Mobile combustion | 13.1118 | 0.1320 | 0.4132 | 0 | 0 | 0 | 0 | 13.6570 |
| 1.3 | Industrial processes (anthropogenic systems) | 0 | 0 | 0 | 0 | 0 | 0 | 0 | 0 |
| 1.4 | Fugitive (anthropogenic systems) | 0 | 115.2378 | 0 | 325.3189 | 0 | 0 | 0 | 440.5567 |
| 1.5 | Land use, land use change and forestry | 0 | 0 | 0 | 0 | 0 | 0 | 0 | 0 |
| Total emissions | 13.6026 | 115.3704 | 0.4143 | 325.3189 | 0 | 0 | 0 | 454.7062 | |
The GHG Emissions information for category 2-6
| Category | Note*1 | Emissions Equivalent | |
|---|---|---|---|
| Category 2: | Indirect GHG emissions from imported energy | 5,695.208 | |
| 2.1 | Indirect emissions from imported electricity | location-based approach | 5,695.2079 |
| Renewable Electricity purchased in kWh with contractual instruments compliant with ISO 14064-1 Annex E | 17SP0020-U022000030~17SP0020-U022000034 & 21SP0056-U022000475 Power Purchase Agreement |
6,000 kWh | |
| Indirect emissions from imported electricity | market-based approach | 5,519.499 | |
| 2.2 | Indirect emissions from imported energy (steam, heating, cooling and compressed air) | NS | - |
| Category 3: | Indirect GHG emissions from transportation | 1,148.674 | |
| 3.1 | Emissions from upstream transport and distribution for goods | S | 42.5595 |
| 3.2 | Emissions from Downstream transport and distribution for goods | NS | - |
| 3.3 | Emissions from Employee commuting | S | 901.9437 |
| 3.4 | Emissions from Client and visitor transport | NS | - |
| 3.5 | Emissions from Business travels | S | 204.1712 |
| Category 4: | Indirect GHG emissions from products used by organization | 2,133.941 | |
| 4.1 | Emissions from Purchased goods | S | 2,088.3857 |
| 4.2 | Emissions from Capital goods | NS | - |
| 4.3 | Emissions from the disposal of solid and liquid waste | S | 45.5548 |
| 4.4 | Emissions from the use of assets | NS | - |
| 4.5 | Emissions from the use of services that are not described in the above subcategories | NS | - |
| Category 5: | Indirect GHG emissions associated with the use of products from the organization | 228.355 | |
| 5.1 | Emissions or removals from the use stage of the product | NS | - |
| 5.2 | Emissions from downstream leased assets | S | 226.7861 |
| 5.3 | Emissions from end of life stage of the product | S | 1.5692 |
| 5.4 | Emissions from investments | NS | - |
| Category 6: | Indirect GHG emissions from other sources | - | |
| Total emissions | 9,206.1780 | ||
| Note 1: | S: Significant S / NS: Not significant |
Sinyi Realty’s Carbon Management Performance
For the purpose of Sinyi’s organizational carbon management, management system enhancement, and emissions reduction, we have introduced ISO 14064-1 and ISO 50001. Since we discovered that emissions of electricity consumption accounted for 92% of GHG emissions (category 1+2), we had put emphasis on energy management. We continuously updated the equipment of our headquarters and branches, purchasing eco-friendly equipment with energy- saving- or eco-labels, introducing UGS EMS and the “DOMI-Smart EMS", adopting visualization services as well as air conditioners and lighting control to get energy data for optimizing energy efficiency. In 2022, the GHG emissions (category 1+2) was reduced by 5.9% and 8.2%, compared with 2021 and 2017.
emissions
reduced
[base year : 2017]
| 2020 | 2021 | 2022 | |
|---|---|---|---|
| Total Electricity Consumption (kWh) | 12,113,090 | 11,983,790 | 11,505,469 |
| GHG Emissions of Electricity Consumption (category 2_market-based)(tonCO₂e) Note 4 |
6,165.564 | 5,845.183 | 5,519.499 |
| GHG Emissions (category 1+2)(tonCO₂e) | 6,771.269 | 6,347.889 | 5,974.205 |
| GHG Emissions (category 3~6)(tonCO₂e) | 4,737.345 | 3,812.354 | 3,510.970 |
| Total Number of Employees | 4,997 | 5,092 | 5,112 |
| GHG Emissions of Electricity Consumption per Person (category 2)(kgCO₂e) | 1,234 [-0.20%] | 1,148 [-6.97%] | 1,080 [-5.92%] |
| GHG Emissions per Person (category 1+2)(kgCO₂e) | 1,355 [0.25%] | 1,247 [-7.97%] | 1,169 [-6.26%] |
| Note 1: | Electricity Carbon Emission Factor in 2020: 0.509 kgCO₂e/kWh; in 2021: 0.502 kgCO₂e/kWh; in 2022: 0.495 kgCO₂e/kWh. |
| Note 2: | GHG emissions were calculated in line with the GWP values used in ver. 6.0.4 of the EPA’ s GHG Emissions Factor Management Chart. |
| Note 3: | GWP values are mainly drawn from the IPCC’s 2013 5th Assessment Report. |
| Note 4: | The category 2 emissions_market- based calculation includes the purchase of renewable energy. |
Sinyi’s Performance Respond to the Special Report on Global Warming of 1.5°C (IPCC)
The Intergovernmental Panel on Climate Change(IPCC) published the Special Report on Global Warming of 1.5°C in 2018, pointing out that to limit global warming to 1.5°C, which is the goal of Paris Agreement, the world needs to “reduce about 45% emissions from 2010 levels by 2030, reach net zero around 2050”.
Sinyi has responded to the 1.5°C goal of Paris Agreement. Because our carbon emissions of electricity consumption account for more than 90% of GHG emissions (category 1+2), we have calculated our carbon emissions of electricity consumption (category 2) since 2010. Compared with 2010, we have reduced carbon emissions of electricity consumption by 41% in 2022.
In addition, Sinyi has participated in the SBTi initiative and set the GHG emission target of " to achieve a 90% reduction in GHG emissions(category 1+2) by 2030.”(Base year: 2017). In the future, we will continue to promote various action plans to reduce carbon emission and improve the efficiency of energy and resource usage, and unswervingly move towards the goal of “Net Zero”, making contributions to environmental sustainability.
Emission Reduction of Electricity Consumption (category 2)