GHG Management
Carbon Footprint
In the face of the increasing impact brought by “climate change”, even if Sinyi Realty is not a major producer of carbon emissions as a brokerage service provider rather than a producer of physical goods, we are still working hard to manage the carbon emissions of our services. We are continuing to innovate and improve green services in respond to customer’s needs. In order to improve the reliability of the quantification of greenhouse gas(GHG) emissions, we have implemented a systemic analysis and quantification of the environmental and economic benefits of our green services, which not only helps to plan sustainable development strategies, but also enable us to pass PAS 2050 verification in 2015. In addition, in 2016 we drafted the world’s first real estate operation services PCR to conduct product carbon emissions, thus obtaining Carbon Footprint Label of per real estate transaction, and also obtained the Taiwan’s first Carbon Reduction Label in real estate industry in 2017. Through optimizing carbon emission reduction projects, we have already reduced 45% carbon emission per transaction compared to the carbon footprint baseline. Therefore, in 2020 we received extension of Carbon Footprint Label and Carbon Reduction Label.
Drafting World's First Real Estate Business Services PCR and Applying for Carbon Footprint Label
A carbon footprint is the sum total of greenhouse gas emissions produced directly and indirectly in the lifecycle of a product or activity, including the extraction and manufacture of raw materials, assembly, transportation, all the way to usage and waste processing or recycling.
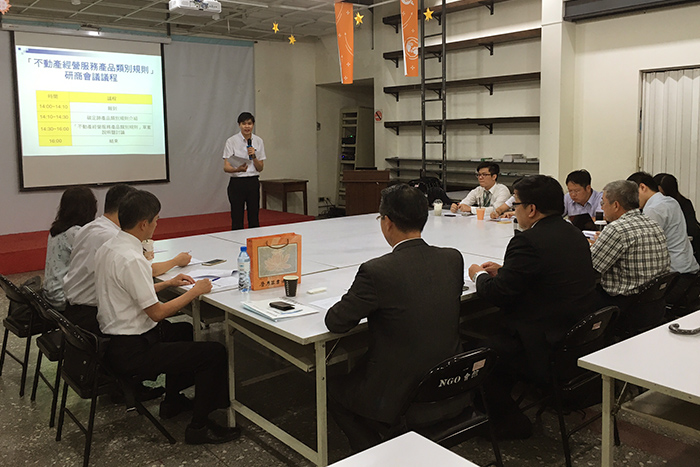
In view of the lack of PCR documentation pertaining specifically to real estate operation services, Sinyi Realty set out to draft the first such rules in the world, providing a resource for others in the industry to refer to when calculating the carbon footprint of real estate operation services. Following the Environmental Protection Administration’s Guidelines for Carbon Footprint PCR Drafting, Citation, and Amendment, we invited domestic experts and stakeholders in the real estate business services field (including real estate agents, brokers, associations, and businesspeople) convening meetings with stakeholders and collecting opinions for the amendment of our draft PCRs. Not only have we established a model for real estate operation services globally, we have also helped harness Sinyi Realty's influence for the positive. After our Real Estate Operation Services carbon footprint PCRs were passed, they were announced on the Taiwan Product Carbon Footprint website.
Product-Category Rules─Real Estate Operation Services
Carbon Reduction Label
In 2014, the Environmental Protection Administration launched their Carbon Footprint Reduction Label (also known as the Carbon Reduction Label), an advanced version of the Carbon Label. The product carbon footprints of Sinyi Realty’s real estate transaction that has received the Carbon Label was taken as the baseline for further reductions. We have already successfully obtained the Carbon Footprint Label for real estate brokerage services (Certificate No. 1616812001) in 2016, and the Carbon Reduction Label (Certificate No. R1716812001) in 2017.
Extension of Carbon Footprint Label and Carbon Reduction Label
In 2019, our carbon emissions per real estate transaction were 307.03 kgCO₂e calculated from the 2015 emission factor, which has already reduced 45% carbon emission per transaction compared to the carbon footprint baseline, that is, 562.77 kgCO₂e in 2015. Thus, in 2020 we received extension to 2025 of Carbon Footprint Label (Certificate No. 2016812001) and Carbon Reduction Label (Certificate No. R2016812001) from the Environment Protection Administration.
Green Real Estate Services - Services Carbon Footprint Inventory
Sinyi Realty has made reference to ISO 14067: 2018 for auditing. Our inventory of each real estate brokerage service began with real estate purchases, sales, and rental demand and went through the entire service process to final contract signing. Emissions of greenhouse gases thus produced and released into the atmosphere then serve as reference data for future efforts and plans to reduce GHG emissions. This inventory includes all GHGs set out in the IPCC 2013 Fifth Assessment Report, including carbon dioxide(CO2), methane (CH₄), nitrous oxide(N₂O), hydrofluorocarbons (HFCs), perfluorinated compounds(PFCs), perfluoropolyethers(PFPE), hydrocarbons, and other compounds controlled by the Montreal Protocol.
In 2017, we calculated carbon emissions for each of Sinyi Realty’s real estate brokerage services, from the acquisition of raw materials to final service, finding a per-service average of 428.46 kgCO2e. We found that advertising paper and contract documents accounted for the largest proportion of the material input and had the greatest impact on the environment. As such, we set about starting from the source of the greatest emissions, developing innovative green approaches and thus reducing per-transaction carbon footprint, doing what we can to reduce our impact on the environment.
The verified service carbon footprint in 2022 was 208.11 kgCO2e, among which 5.45 kgCO2e in materials input stage, 198.96 kgCO2e in service stage, and 3.7 kgCO2e in waste stage. Compared to base year (2017) the service carbon footprint was reduced by 51.4%.
| Note 1: | Production demands made with commissioned actors are considered personal behavior of clients and thus not within the scope of the inventory. |
| Note 2: | Should an aforementioned service not provide service items, it is unnecessary to include it within the scope of the inventory. |
Green Digital Transformation
Traditional brokerage service send DMs and paper dispatches to the mailboxes of community residents, made it difficult to accurately find potential customers and respond to their immediate needs. Through our carbon footprint inventory, we found that the greatest percentage at the materials input stage of our carbon footprint was in the form of paper dispatches and as such we have made reducing paper-based advertising materials a primary innovation target. We started the digital transformation, established a digital dispatches system, Line@ account, and launched “DiNDON-Smart House Viewing Service”, etc., so as to make a matching between products and customer’s needs more accurate. Through this transformation, we can not only improve the efficiency and quality of our services, but also reduce the paper usage and waste, which achieve carbon footprint reduction. This is a win-win strategy that improves our operating competitiveness and contributes to the sustainability.
PCR stakeholders meetings
Carbon label disclosure diagram for Sinyi Realty branches

carbon labeling product information
* Carbon footprint labeling (also known as carbon labeling or carbon emissions labeling) is a labeling that applies to the emissions of a company, its production processes, products/services, and individuals, indicating that all stages of the life cycle of a product or service, from obtaining of raw materials through processing, distribution, sales, end-user, and disposal/recycling, has had its GHG emissions calculated in terms of kilograms of carbon dioxide equivalent (CO₂e) equivalent. From the Taiwan Product Carbon Footprint website.
The Performance of Paperless in Sinyi Realty
Sinyi Realty has found out that emissions from paper usage in transactions is the largest emission source in material input stage, thus we viewed the paper usage reduction in service as one of our green goals. Innovated digital services have been launched, such as Top Agent App, DiNDON Smart House Viewing Service, online instruction of real estate and commission, which not only improved the efficiency and quality of our services, but also reduced the paper usage and waste. As a result, paper consumption has been declined since 2015. In 2022, paper usage per service was 1.26 kg, reduced by 96% compared to base year (2017).
per Transaction
Reduced by
[base year : 2017]
| Year | 2022 | 2021 | 2017(base year) |
|---|---|---|---|
| Paper usage of per transaction (kg) | 1.26 | 6.89 | 31.73% |
| Increasing rate compared with 2022 (%) | - | -81.7% | -96% |